WORLD BANK

Computer screen displaying a login page with username and password fields, a bright blue login button, and options for forgotten password and sign-up.

InfoDev Prototype proposal
UX/UI Branding, ISL
2016

Junior Designer

GOAL: Create a platform that would incentivize data exchange for entrepreneurs within InfoDev incubators, independent of acceptance into programs and their associated funding.

Multiple digital dashboards with data visualizations, charts, and graphs on a dark blue background, featuring titles like "Analytics Dashboard" and "Track Goals".

InfoDev

Entrepreneurs were expected to provide business data on a quarterly basis—collected through surveys and personal interviews conducted by incubator leadership. Despite the great resources and funding provided by InfoDev, the incubator leadership teams were challenged to collect regular and complete business data from the entrepreneurs, while they were part of the incubator, and any data the business had ‘graduated out’ of the year-long program.

The composite business data of those within the incubator and their success after graduating out is essential to the individual incubators proving their success and garnering funds, both from the World Bank as well as additional outside sources.

Multiple digital tablets displaying various dashboards, graphs, and interface screens with a dark blue and gray color scheme.

Working with the World Bank, we interviewed the Nairobi incubator leadership and some of its entrepreneurs, to understand the current responsibilities and pain points. What we also realized was that there are significant challenges to their cellular systems. Our recommendation was a business data management, cloud-based software system.

Digital data analytics dashboard with charts and figures related to unit economics, revenue, break-even points, and sales summary, overlaying a dark blue background with white and blue text and icons.

At its core, the system focused on the entrepreneur’s ability to manage and understand their business data in a convenient way. Administrators of the system are able to pull the data down from the backend and see the success of their incubator in real time. They can also see when certain businesses are in need of assistance and begin to see trends for success that will better enable them to help future entrepreneurs.

Dark-themed UI style guide showcasing various form elements, including input fields, dropdowns, checkboxes, switches, and error states in a dark color scheme with light text and accents.

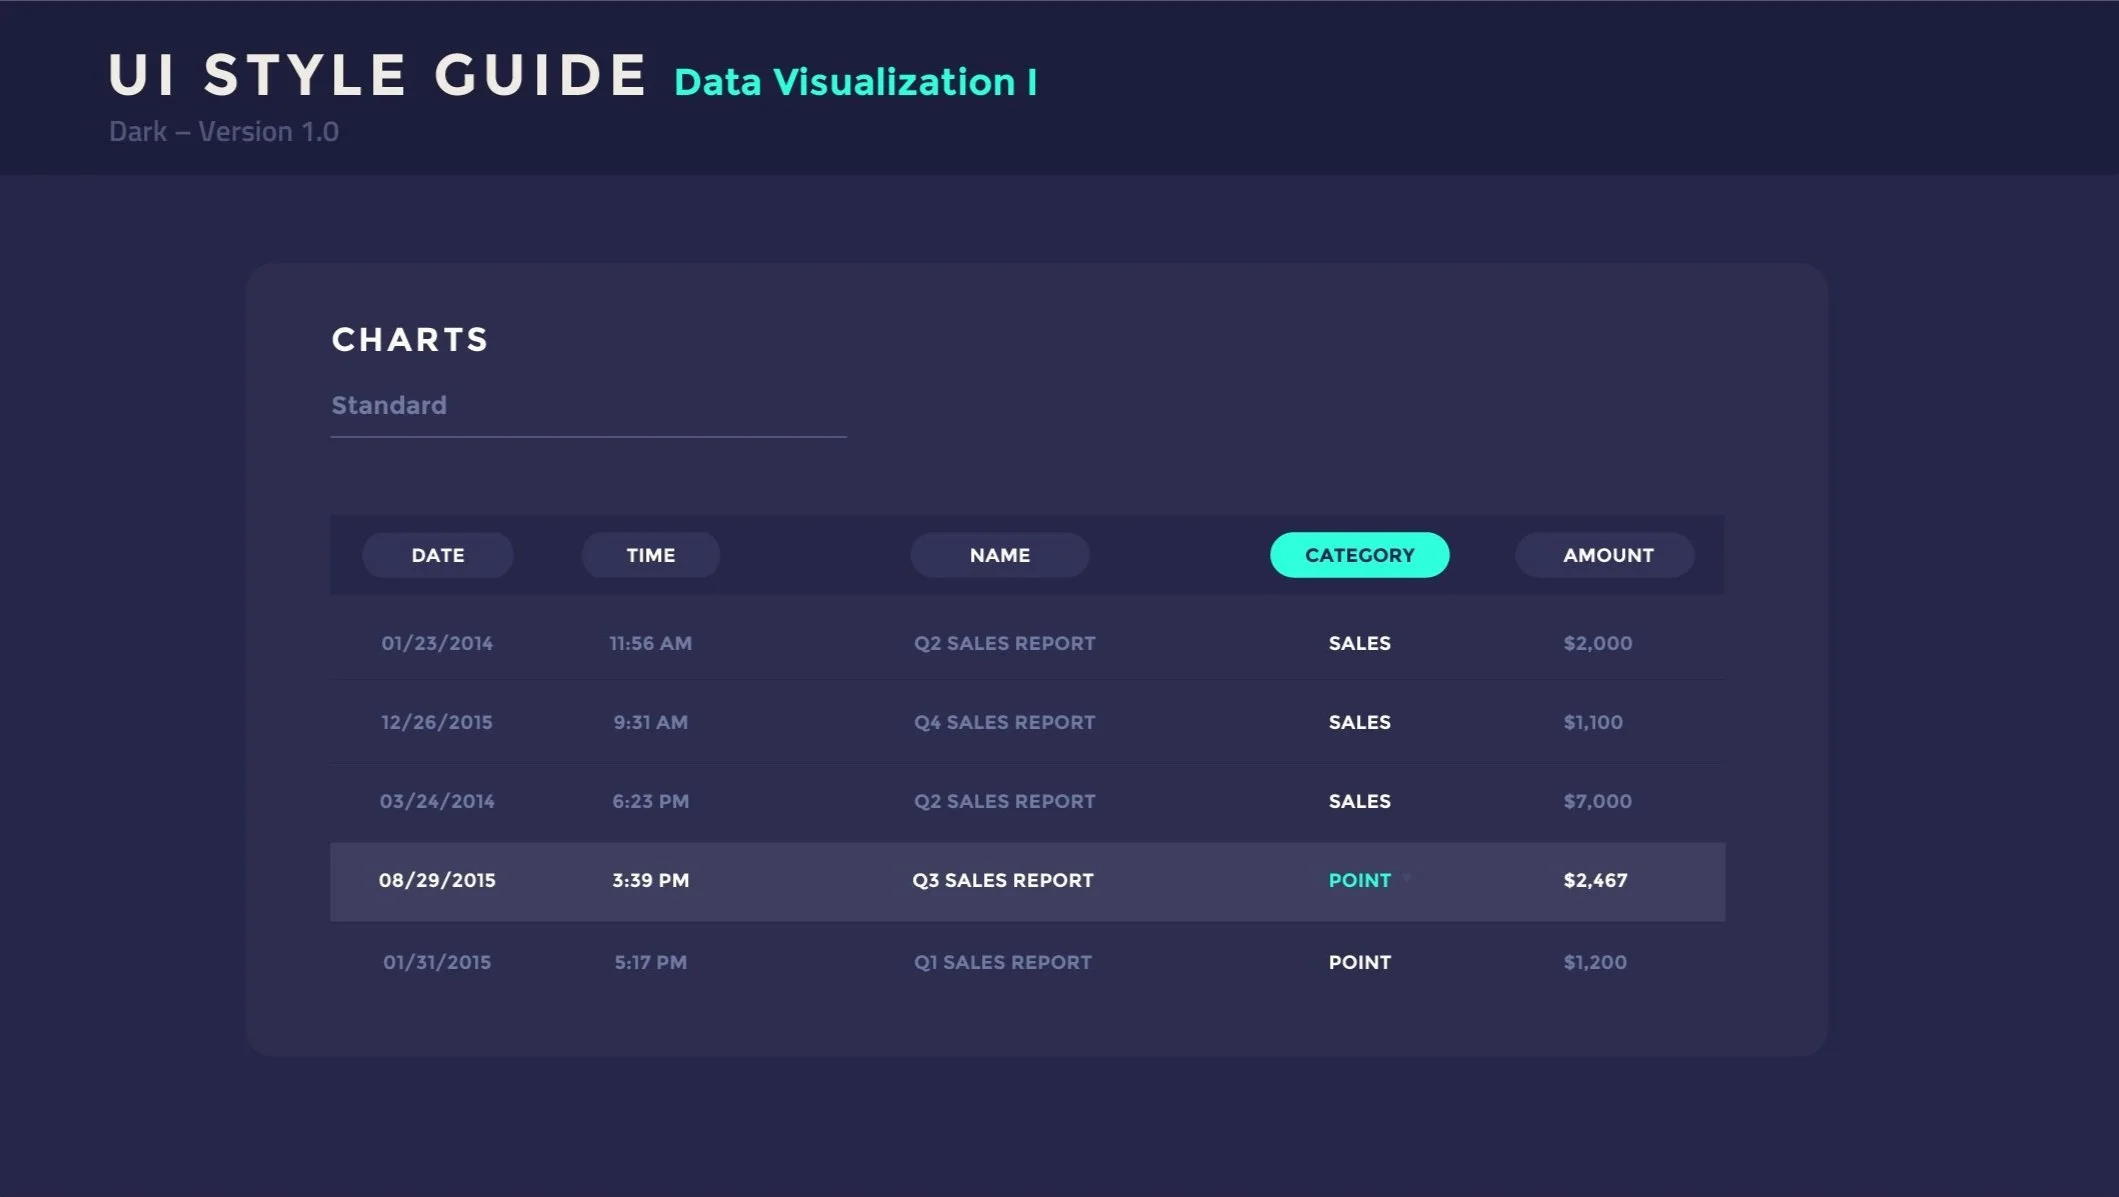
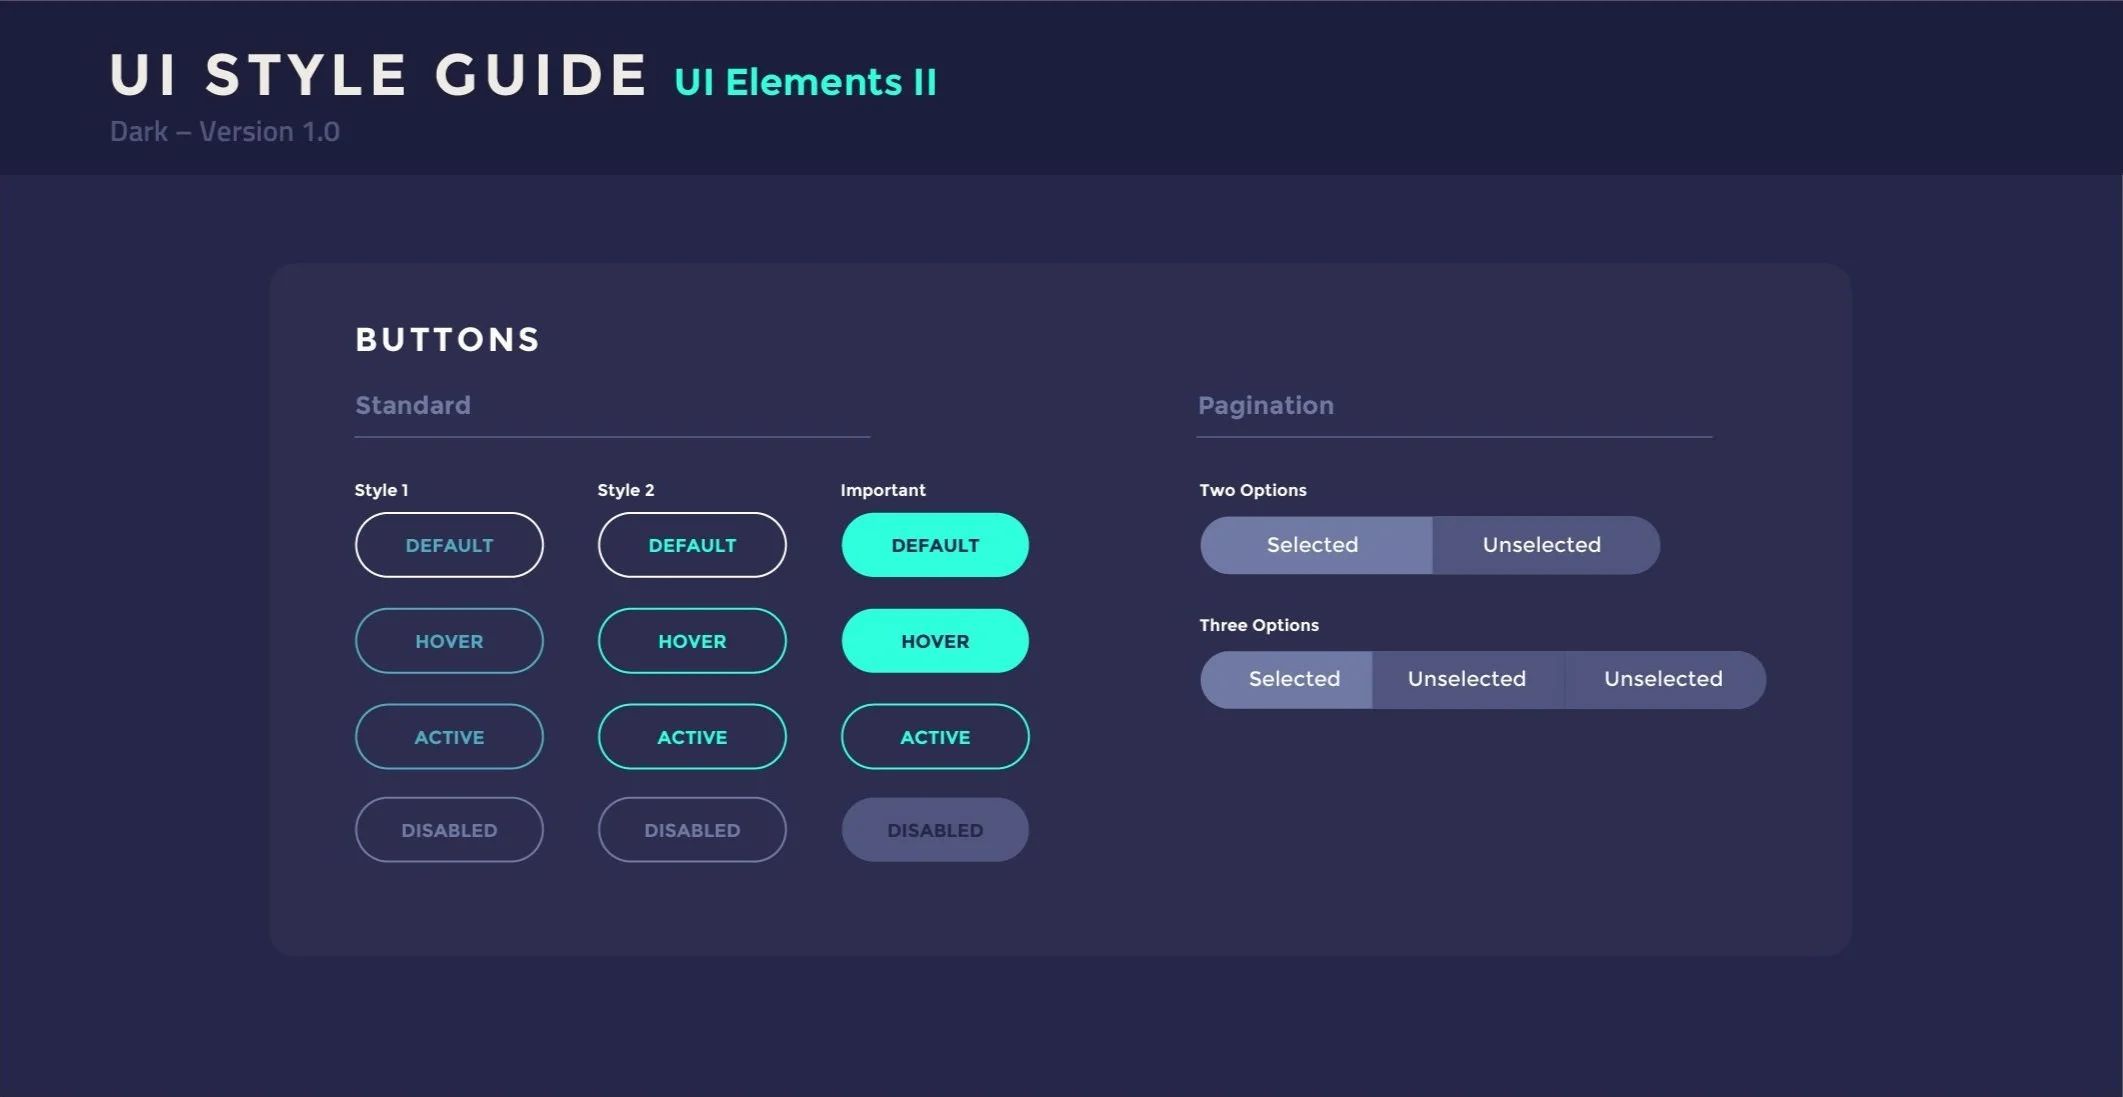
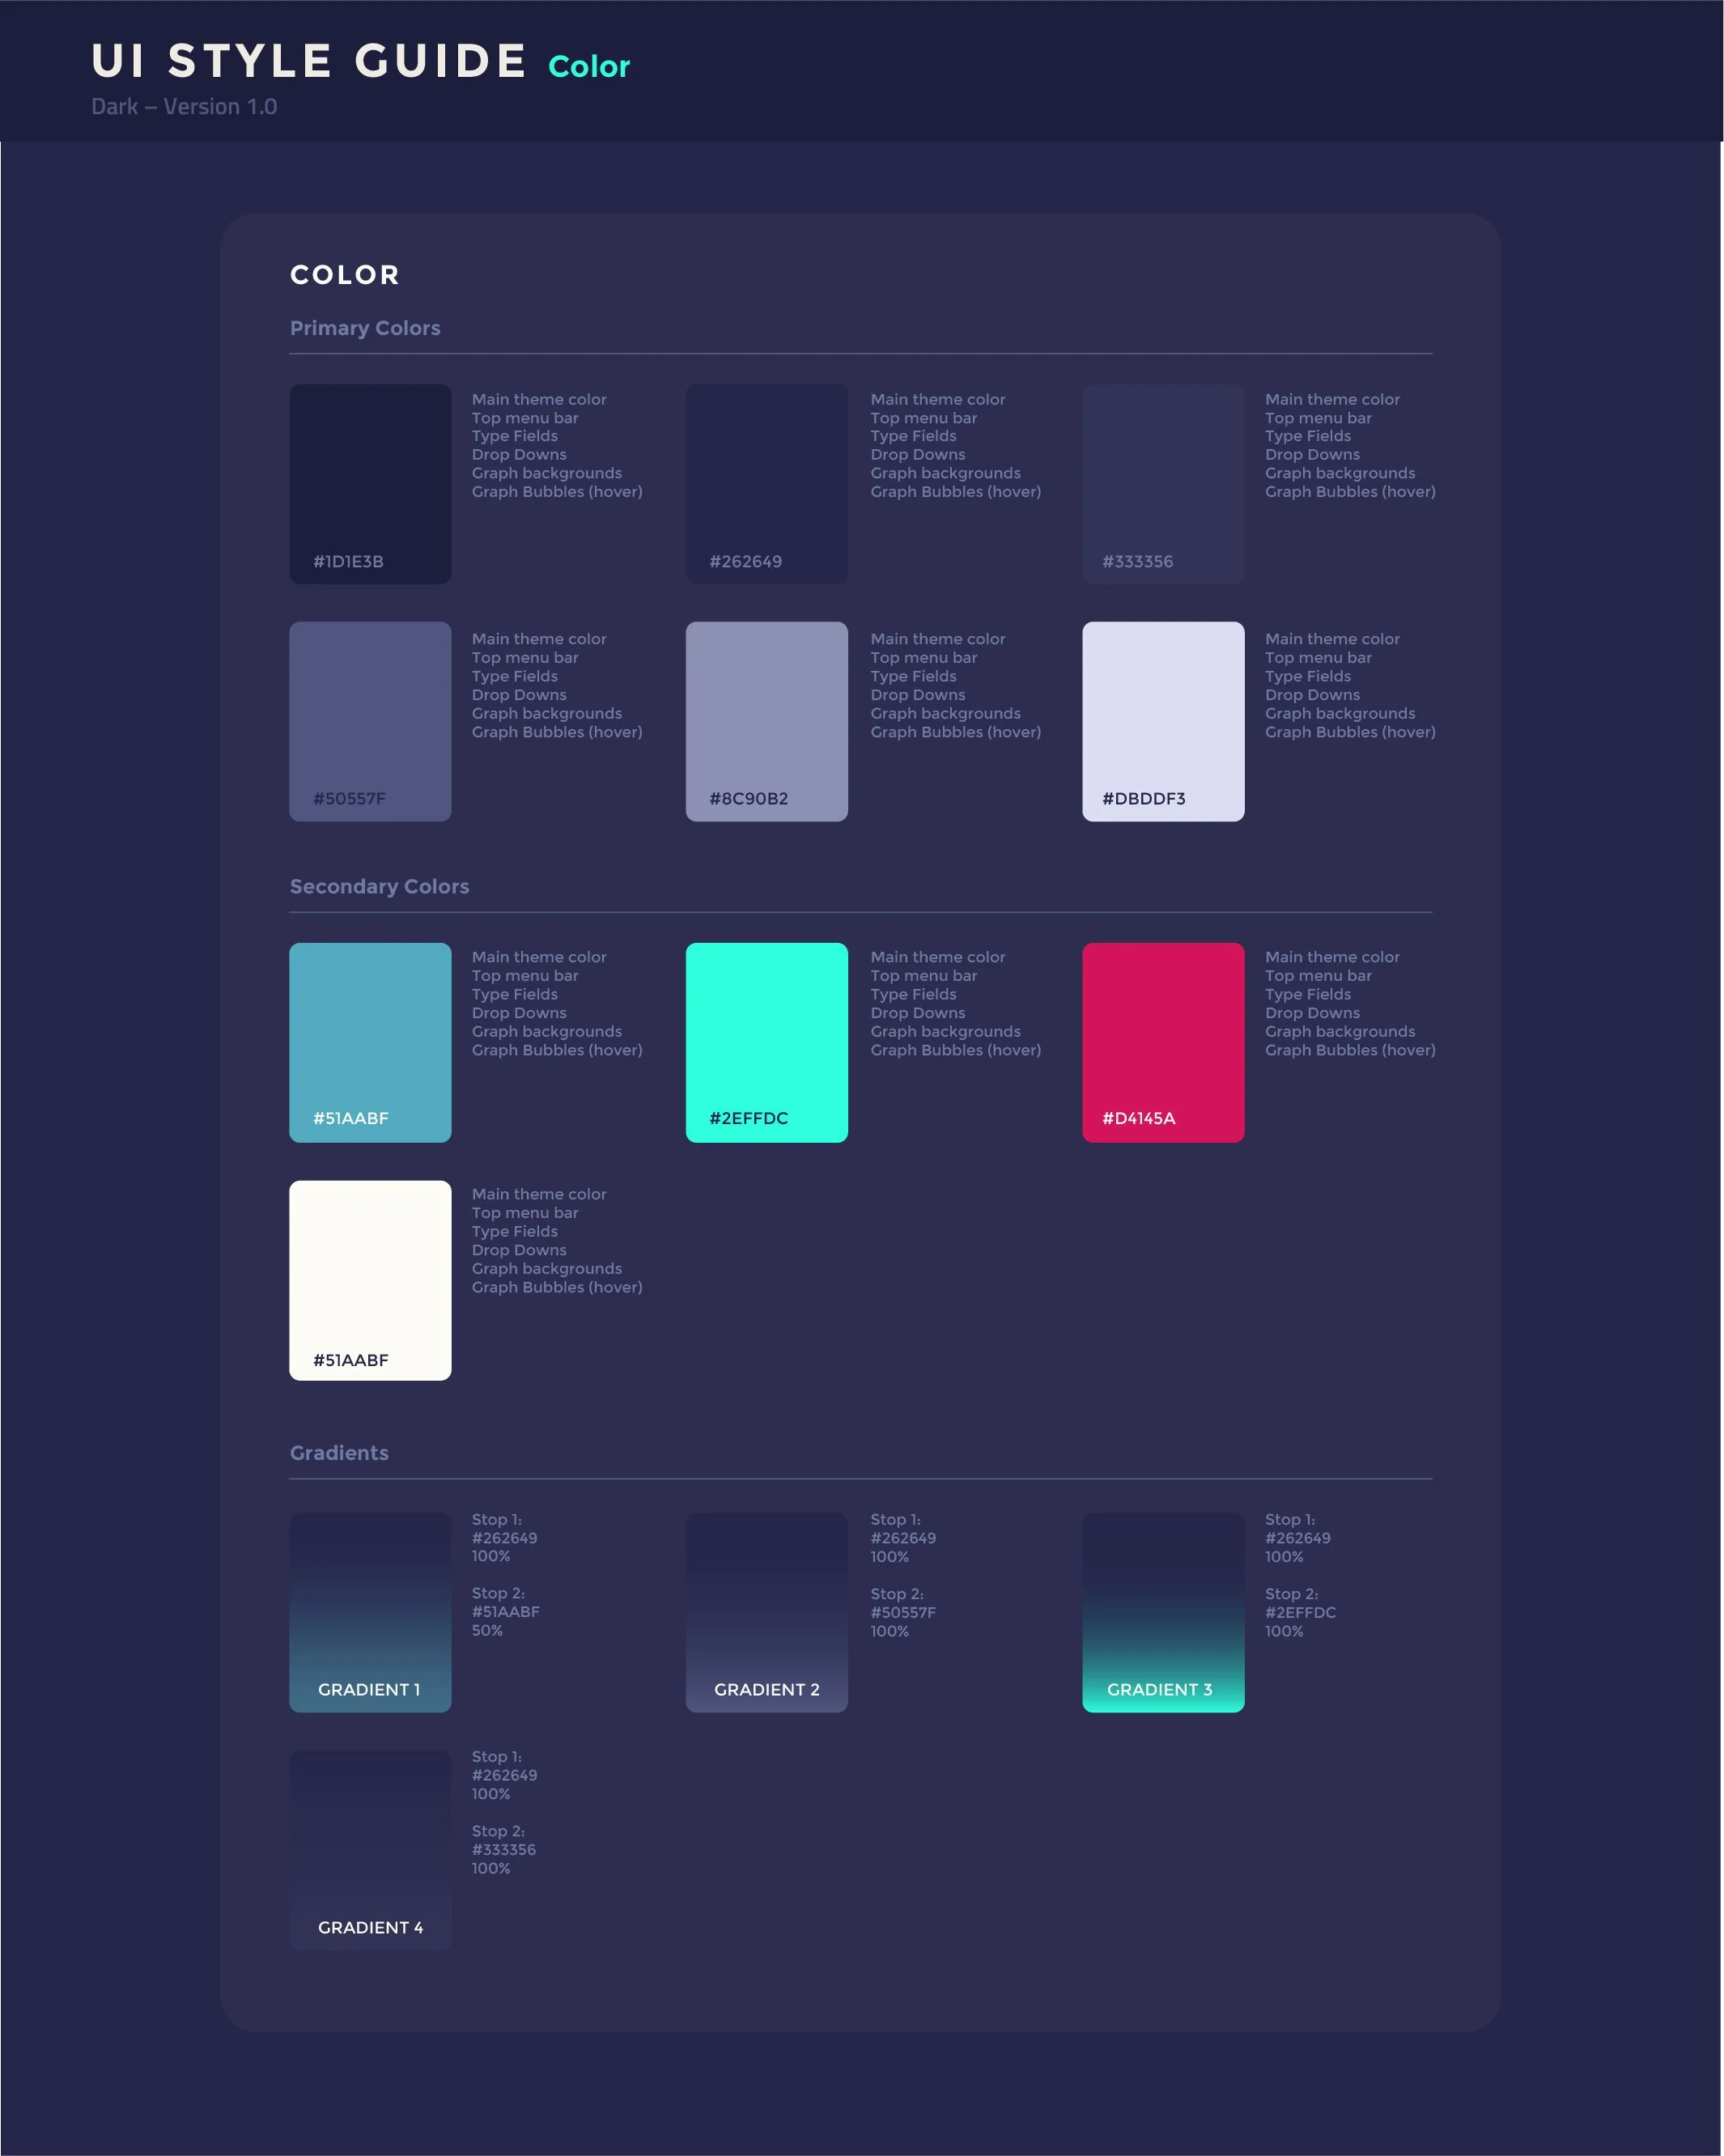
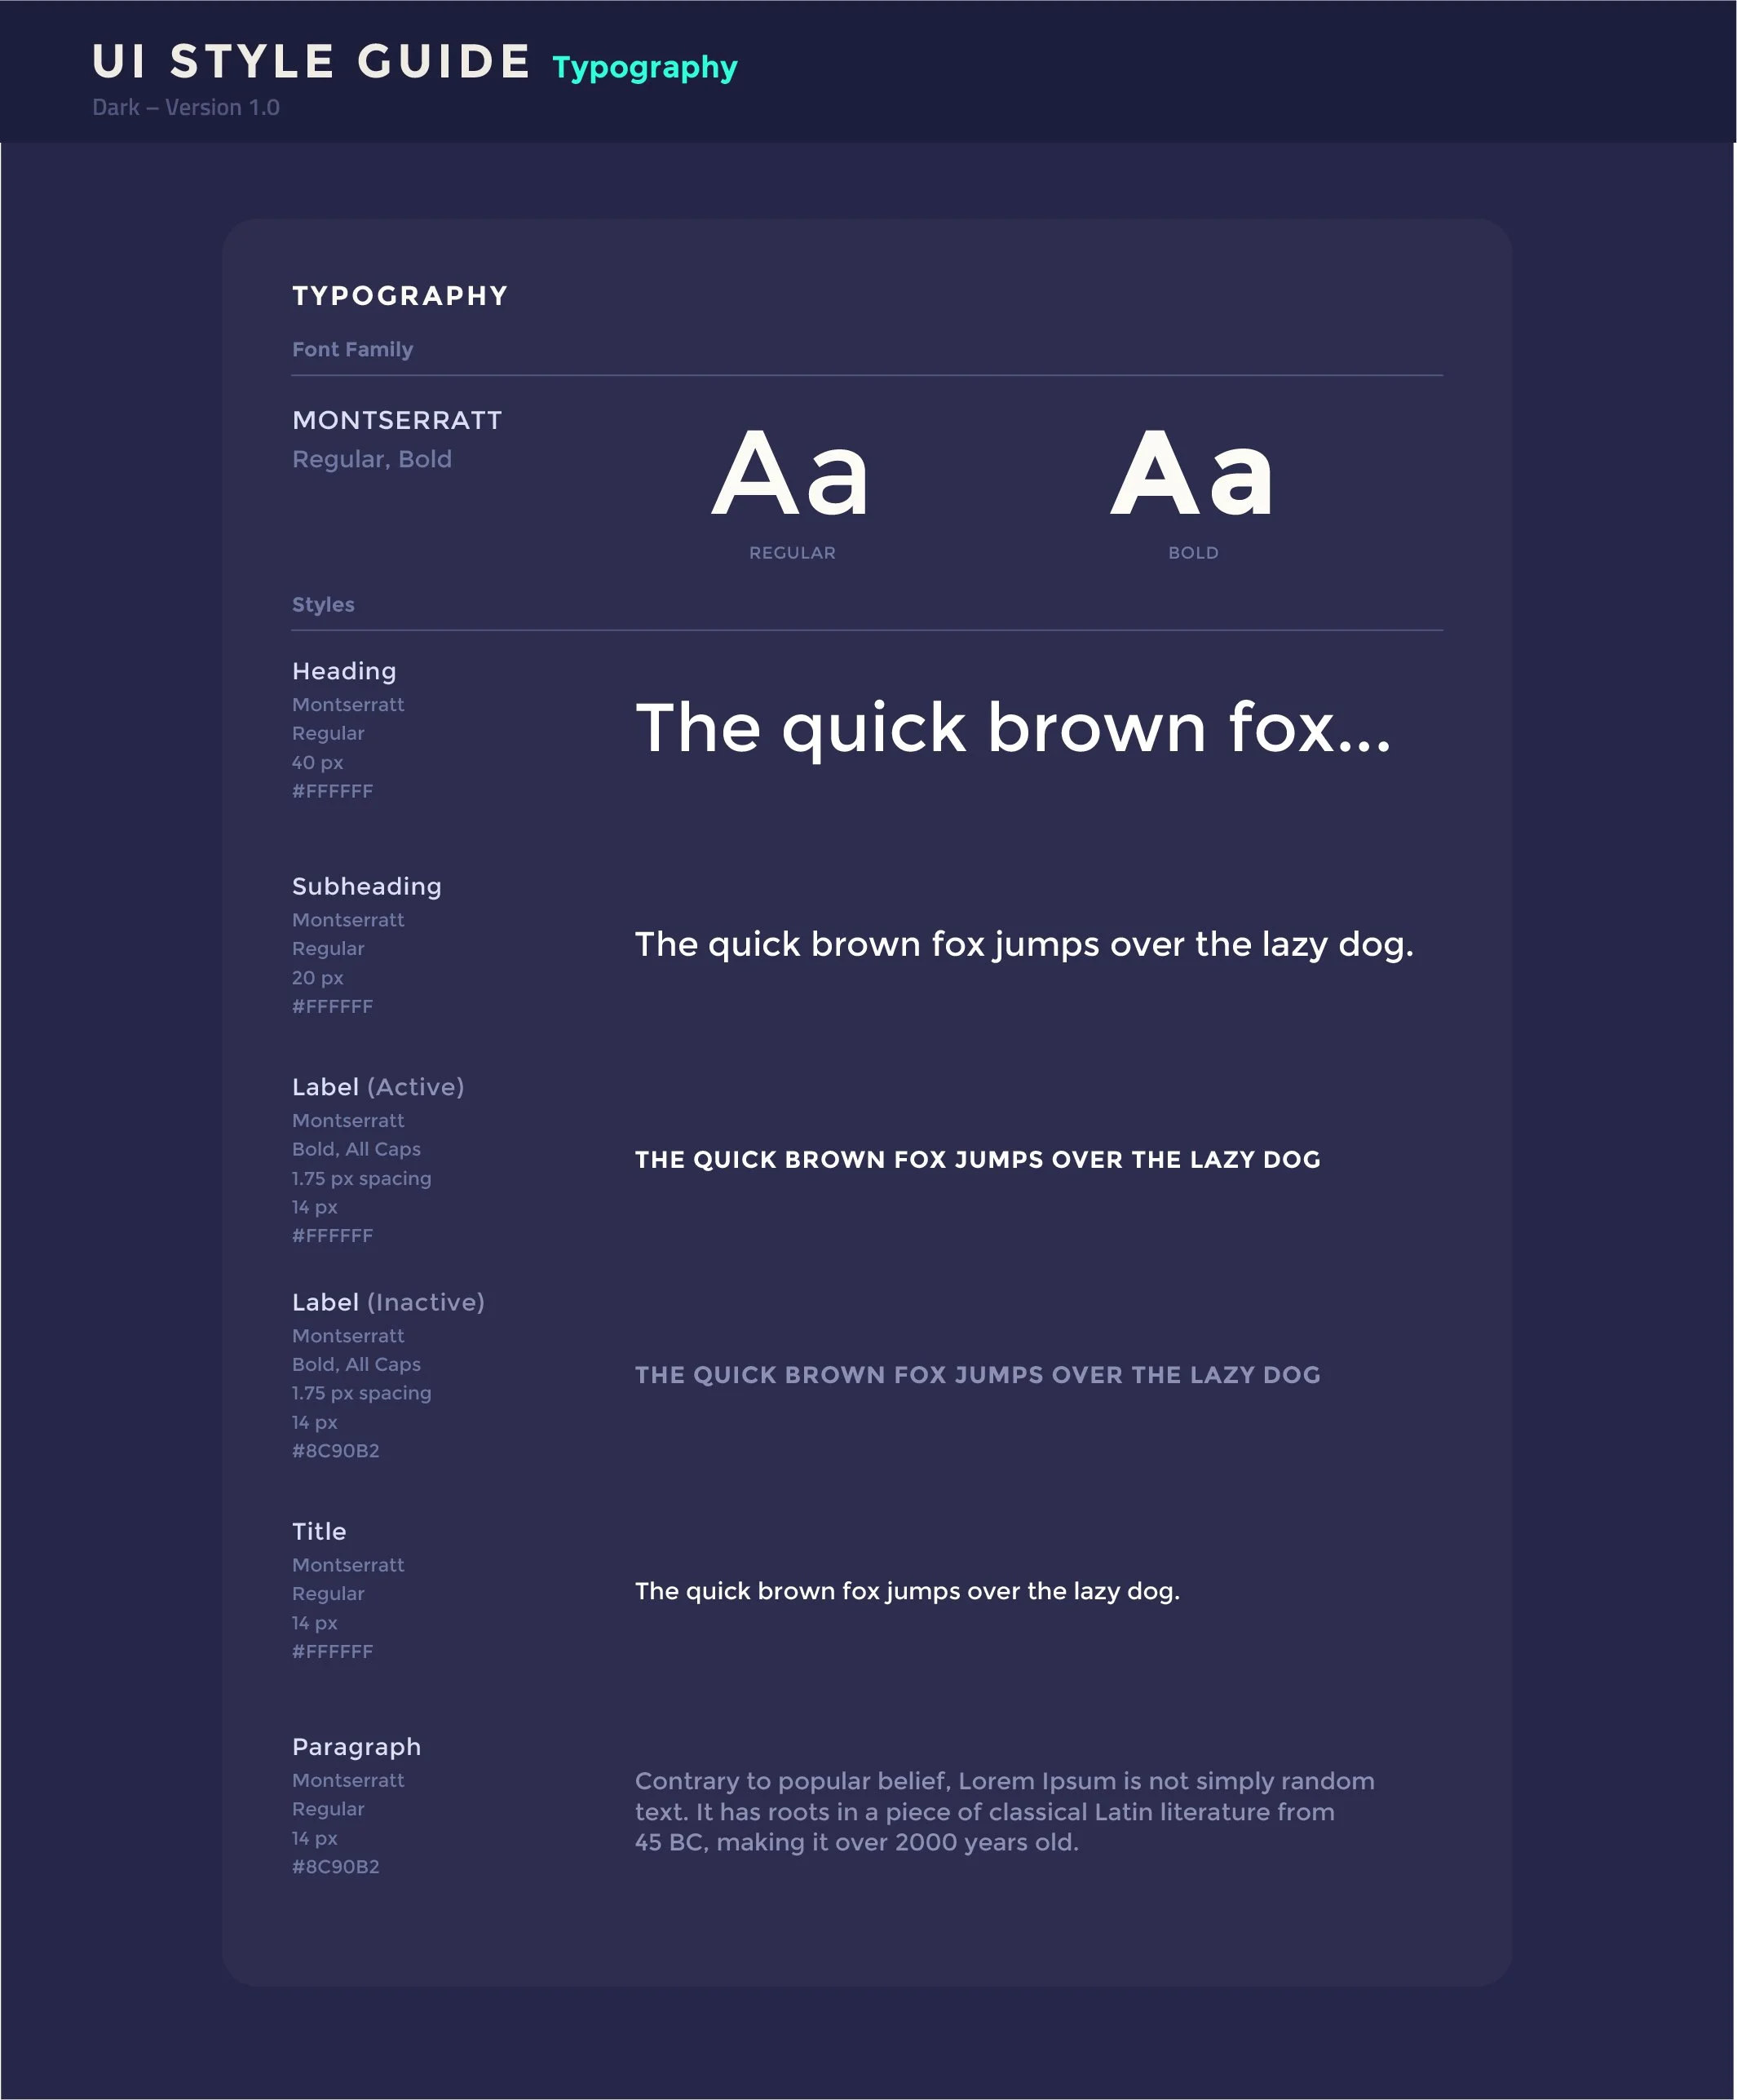
Style guide of how the system would look and feel.

Screenshots of a dark-themed dashboard user interface with multiple pages displaying charts, graphs, and profile information related to business analytics and management.
A digital form on a dark blue background for setting up a company account for Kenya Climate Innovation Center, including fields to upload a logo, enter company name, website, select sector, indicate if the product/service is in the market, add founders, and a bright cyan 'Go' button.
UI style guide for data visualization with a table of sales reports, including columns for date, time, name, category, and amount, on a dark themed background.
A dark-themed UI style guide showcasing button styles and pagination options with various color and interaction states.
Dark-themed UI style guide page displaying primary and secondary color palettes, with their respective color swatches and hex codes, along with four gradient samples showing color transitions.
A dark themed UI style guide showing various typography styles and examples of the phrase 'The quick brown fox jumps over the lazy dog' in different font weights and sizes, with sample text and color codes.
A dark-themed UI style guide page showing typography styles like font family, weight, sizing, and color, with example texts including headlines, subheadings, and body text, all centered on the page.